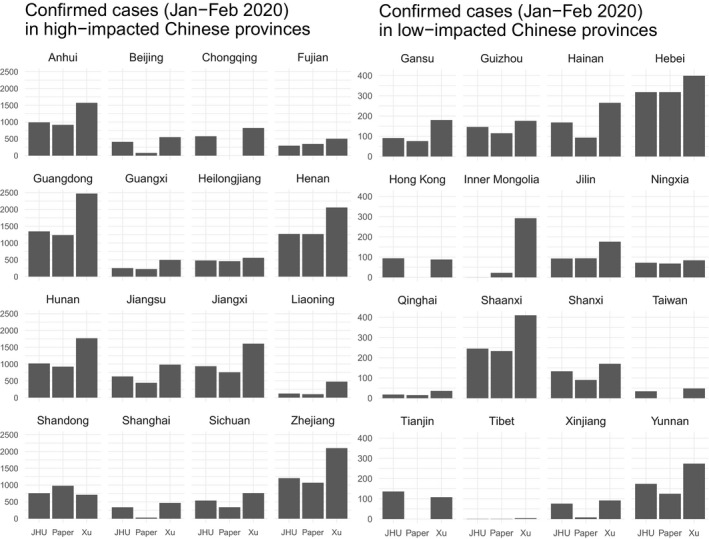
FIGURE 1.

Cases of coronavirus in high‐impacted (left panel) and low‐impacted (right panel) provinces in China. The plot indicates the number of coronavirus‐infected individuals in China in high‐impacted (left panel) and low‐impacted (right panel) provinces from January to February 2020. Note that data from Macau are included in Guangdong province. Sources (updated April 9, 2020): (left bar) Johns Hopkins University CSSE (Johns Hopkins University Center for Systems Science & Engineering, 2020), (center bar) The Paper (Pengpai News Agency, 2020a), and (right bar) (Xu et al., 2020)
