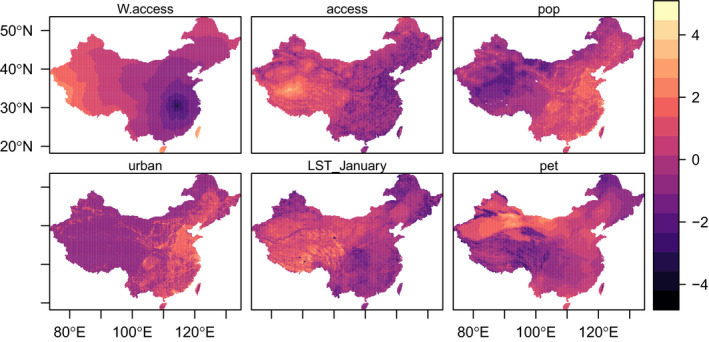
FIGURE 3.

Covariates investigated in the downscaling model. The maps show the standardised values of six potential covariates used in the downscaling model. We investigate travel time to Wuhan, China (W.access), travel time to to the nearest city with more than 50,000 inhabitants (access), population size (pop), urbanity (urban), January land surface temperatures (LST), potential evapotranspiration (pet) [Colour figure can be viewed at wileyonlinelibrary.com]
