
FIGURE 5.
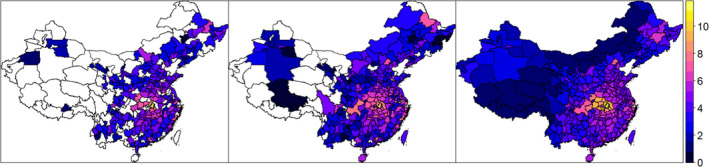
The Paper, Xu et al., and estimated cases (January–February 2020) with downscaling (natural logarithm scale) in Chinese districts. The maps show the number of (natural log) COVID‐19 infected cases for January and February 2020 at district‐level (340 districts) in China from the Paper (left), Xu et al. (center), with blank areas corresponding to locations without observations provided by the corresponding disaggregated dataset. Right: estimated (natural log) mean infected cases based on the downscaling approach [Colour figure can be viewed at wileyonlinelibrary.com]