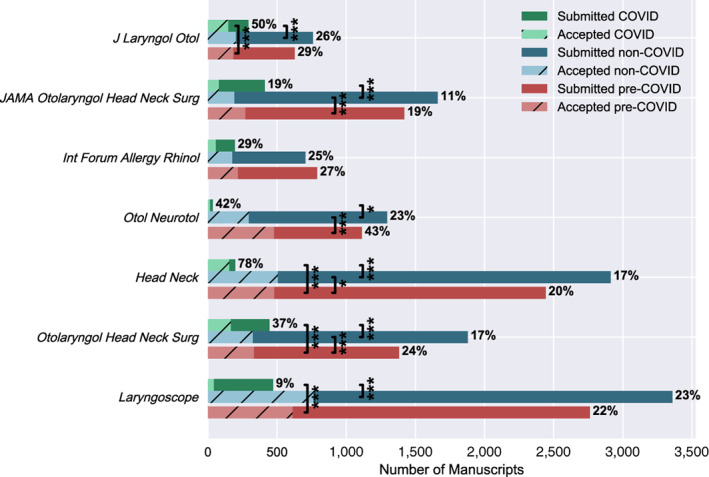
Fig. 3.

COVID, non‐COVID, and pre‐COVID submissions. Number of unique submissions and accepted publications from April 2019–April 2020 (pre‐COVID) and April 2020–April 2021 (non‐COVID and COVID) show that a majority of selected top ENT journals had higher acceptance rates for COVID articles, compared to non‐COVID articles. Percent of articles accepted annotated on graph. Chi‐square P‐values identifying significant differences in acceptance rates between time period for each journal is shown on the figure as follows: *P < .05, **P < .01, ***P < .001.
