
FIGURE 3.
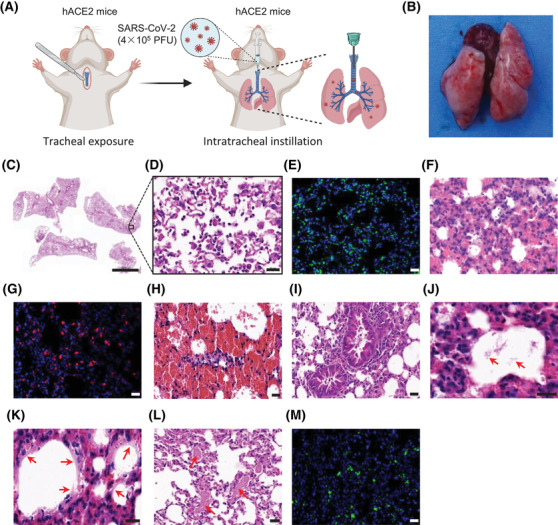
The pulmonary features of a mouse model for SARS‐CoV‐2‐induced ARDS. (A) An illustration for route of the establishment of a mouse model for ARDS. (B) The gross observation for pulmonary morphology on 5 dpi. (C–D) Images of H&E staining for pulmonary pathological changes of mice on 5 dpi. (E) Images of TUNEL staining for cell apoptosis in lung tissue on 5 dpi. (F–G) Images of H&E staining (F) and immunofluorescence staining for Ly6G (G) indicate the neutrophils as the predominant cell infiltration with 60% of the lung tissue. (H–L) SARS‐CoV‐2 infection induces apparent hemorrhage (H), inflammatory cells (I), proteinaceous debris (J, red arrow), hyaline membranes‐like changes (K, red arrow), and thrombi (L, red arrow) in the lung tissue of the mouse model. (M) Images of immunofluorescence staining for SARS‐CoV‐2 spike protein in the lung section of a mouse with SARS‐CoV‐2‐induced ARDS. Scale bars represent 2000 μm (C) or 20 μm (D‐M). Reprinted with the permission from a published reference 25