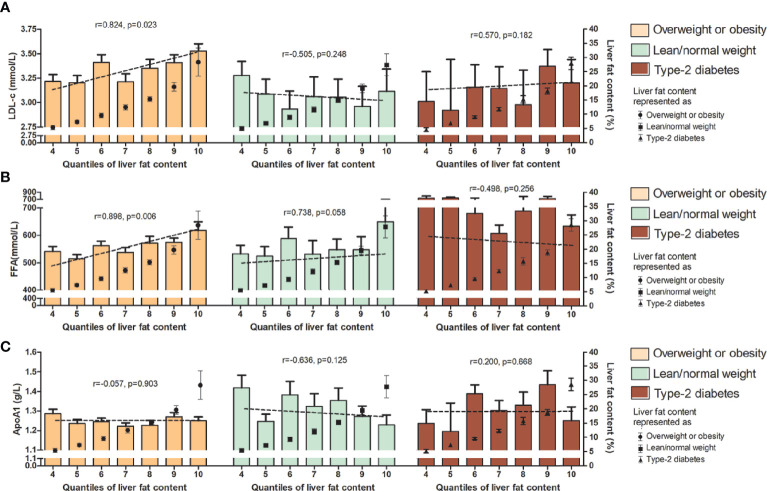
Figure 2.
Serum level (upper range) of LDL-c (A), FFA (B), and ApoA1 (C) among the 10 quantiles of LFC in the subgroup of phenotypes of MAFLD. Cutoff discriminating the 10 groups were as follows: quantile 1 (<1.5%); quantile 2 (1.5%–2.7%); quantile 3 (2.8%–4.1%); quantile 4 (4.2%–6.5%); quantile 5 (6.6%–8.4%); quantile 6 (8.5%–11.1%); quantile 7 (11.2%–14.1%); quantile 8 (14.2%–17.1%); quantile 9 (17.2%–22.4%); and quantile 10 (>22.4%). The bars represent serum level of certain lipids or apolipoproteins among each quantile group. Dotted lines represent correlations certain lipids or apolipoproteins and liver fat content based on individual data. Black dots represent the mean (range) of intrahepatic fat content in each quantile group. LFC, liver fat content; MAFLD, metabolic associated fatty liver disease; LDL-c, low-density lipoprotein cholesterol; FFA, free fatty acid; ApoA1, apolipoprotein A1.

