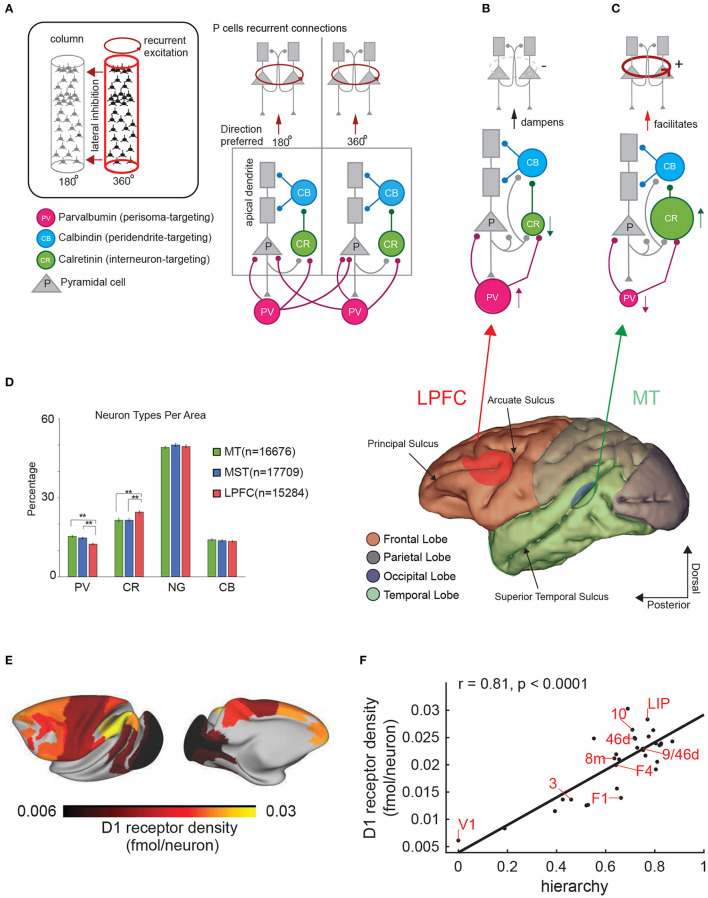
Figure 4.
Cortical architectures for perception and working memory. (A) Diagram showing the structure of two nearby cortical columns and the four main cell types (see inset). Observe pyramidal cells have at least two distinct compartments, the apical (distal) dendrites (gray rectangles) and the cell body. (B,C) different architectures based on the proportion of CR and PV interneurons and the ability to produce persistent firing. Lower panel shows a side view of the macaque brain and the different lobes in different colors. (D) Percentages of the 4 main cell types in areas MT, MST, and the LPFC (from Torres-Gomez et al., 2020). Distribution of Dopamine D1 receptors in the macaque brain. The color scale indicates the receptor density. (F) Correlation between position of a brain area in the hierarchy of visual processing and D1 receptor density. Each data point represents a brain area. The correlation coefficient and associated p-value are indicated courtesy of Froudist-Walsh et al. (2020). (E) D1 receptor density across the macaque cortex.

