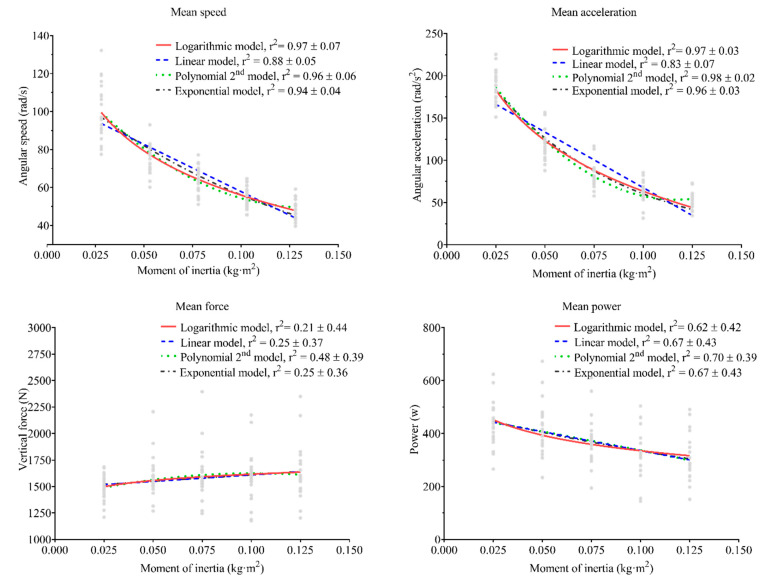
Figure 1.
Association between each mechanical variable and the moment of inertia used, with different fitting models. r2 shows the mean ± standard deviation coefficient of determination for each model. The lines represent the regression line for each model, while the gray points represent individual values for each subject.

