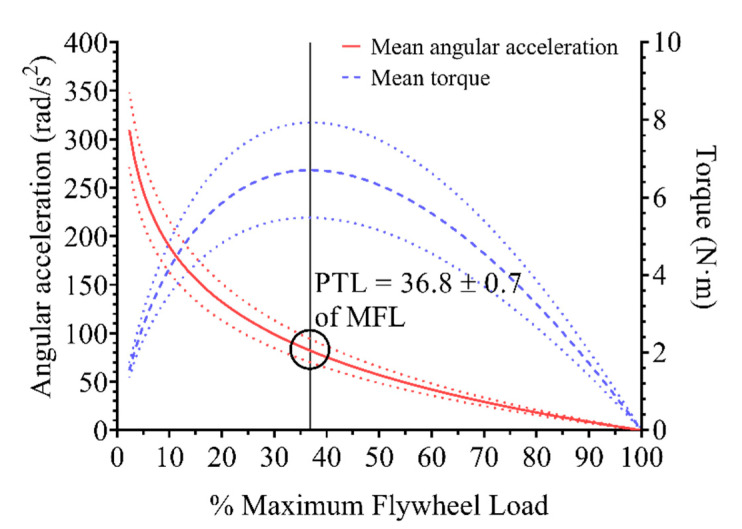
Figure 2.
Association between mean angular acceleration and mean torque versus relative flywheel load. Lines represent mean ± standard deviation (dotted lines) of all the subjects’ individual regression lines (logarithmic fit for angular acceleration and second-degree polynomial for mean torque). The vertical black line represents the relative inertia at which peak torque load (PTL) is attained as a function of maximum flywheel load (MFL).

