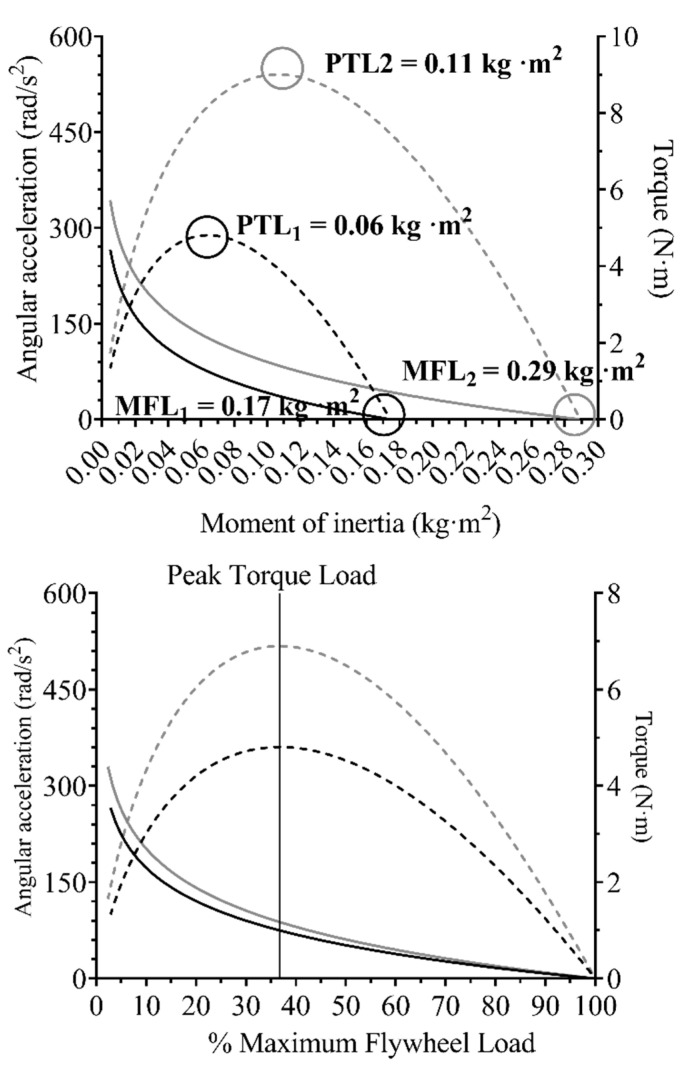
Figure 3.
Illustration of the maximum flywheel load index concept. The upper graph shows the acceleration regression line (continuous line) and the torque regression line (dashed line) of a subject with a lower maximum flywheel load (MFL, black color) against a subject with a higher MFL (gray color). MFL is calculated as the intercept of the acceleration curve on the horizontal axis. The lower graph compares both subjects’ profiles using relative intensities instead.

