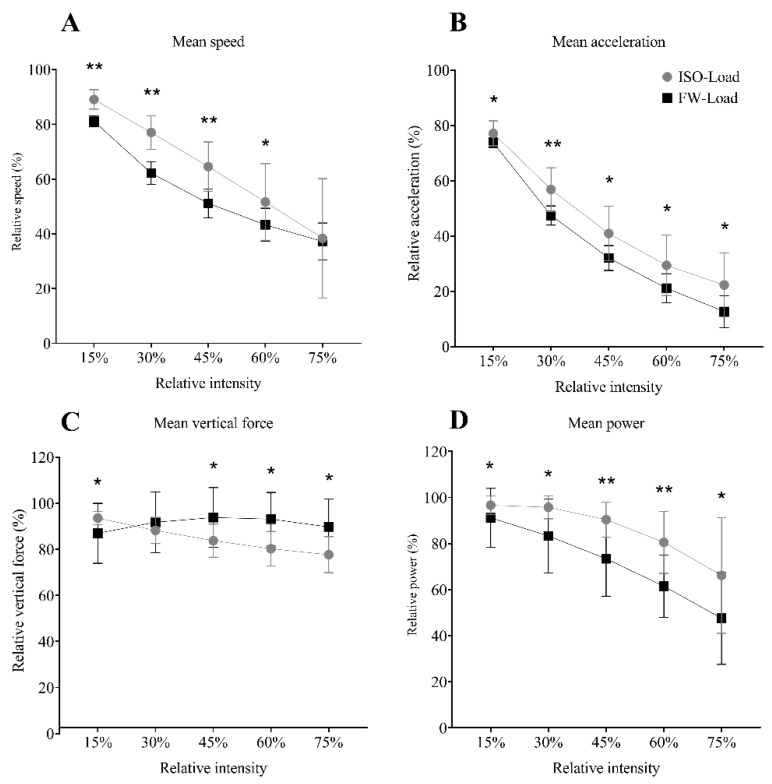
Figure 5.
(A) Estimated data normalized from maximum speed; (B) acceleration; (C) vertical force, and (D) power for five relative intensities (training intensity continuum) for the flywheel (FW-load) and weight load types (ISO-load). Data points represent mean values, and error bars the standard deviation. Between loading condition differences are shown as: * = p < 0.05, ** = p < 0.001.

