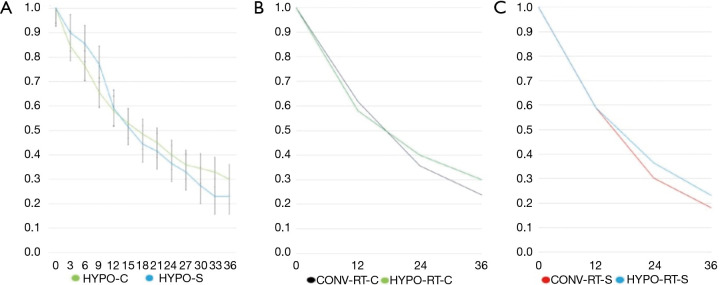
Figure 3.
Kaplan-Meier curves comparing the survival with different radiotherapy and chemotherapy combinations. (A) A representative Kaplan-Meier curve showing the survival of patients treated by HYPO-RT with sequential (S) and concomitant (C). (B) Kaplan-Meier curve of patients treated by HYPO-RT-C and CONV-RT-C. (C) Kaplan-Meier curve of patients treated with HYPO-RT-S and CONV-RT-S. HYPO-RT, hypofractionated radiotherapy; CONV-RT, conventional radiotherapy.

