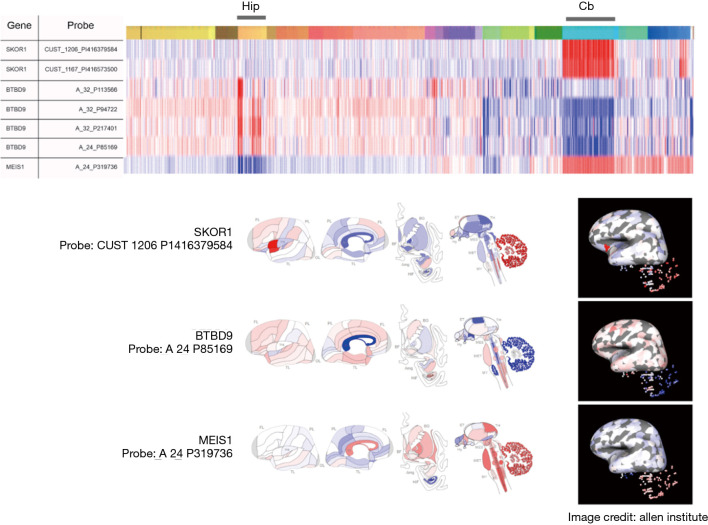
Figure 1.
Genes associated with PLMS. Levels of gene expression for SKOR1, BTBD9 and MEIS1 across different anatomical regions of the human brain as heatmaps or as drawings are shown. SKOR1 and MEIS show highest expression in the Cb, while BTBD9 shows highest expression in hippocampal regions (Hip). Donor H0351.1016; adapted and data available from Human Brain Atlas of Allen Institute (193). Amg, amygdala; BG, basal ganglia; Cb, cerebellum; ET, epithalamus; FL, frontal lobe; HiF, hippocampal formation; Hy, hypothalamus; INS, insula; MES, mesencephalon; MET, metencephalon; Mid, midbrain; MY, myelencephalon; OL, occipital lobe; Pons, pons; PL, parietal lobe; TH, thalamus; TL, temporal lobe; PLMS, periodic limb movements during sleep.

