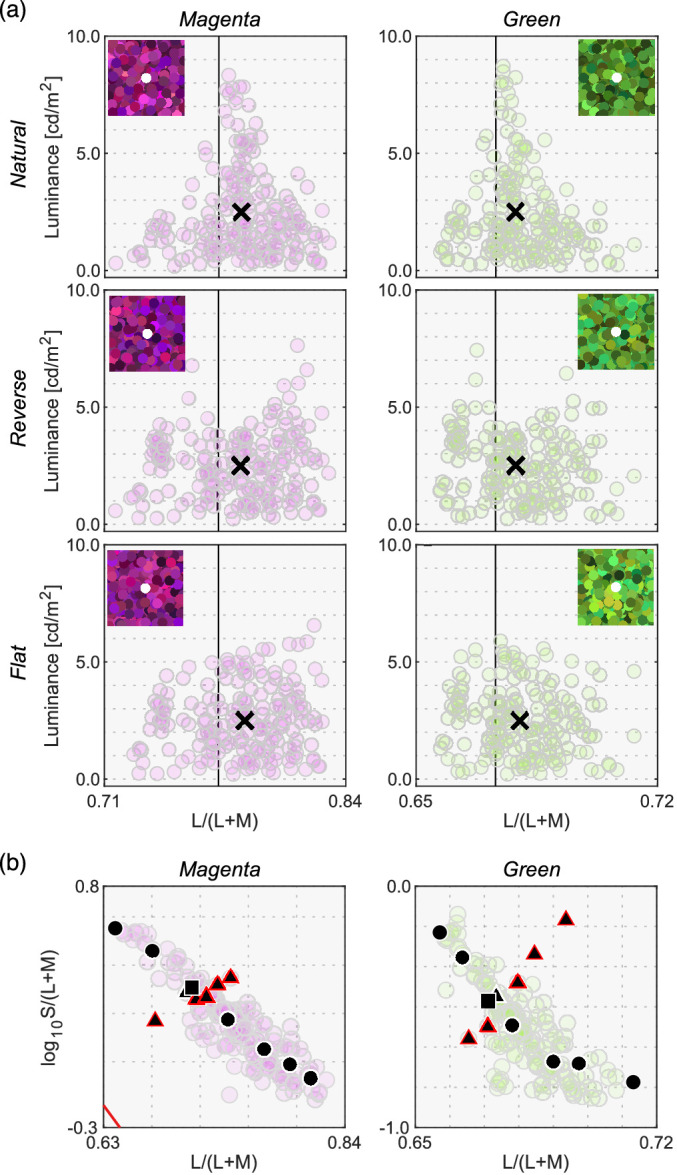
Figure 12.

(a) Six color distributions for surrounding stimuli (2 test illuminants × 3 distributions). Inserted image shows an example stimulus configuration. The vertical solid black line indicates the L/(L + M) value of test illuminant. Black cross symbols indicate mean cone response values across 180 surrounding stimuli. (b) Thirteen test chromaticities at which the luminosity threshold was measured. Symbols with a red edge indicates reflectances that were not shared between magenta and green illuminants.
