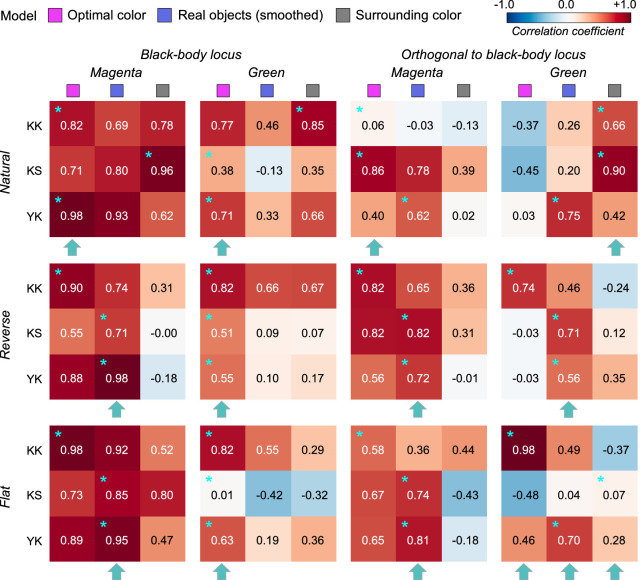
Figure 14.
The matrices of Pearson's correlation coefficient calculated between observer settings and model predictions over seven test chromaticities in Experiment 3. The cyan star symbols indicate the highest correlation coefficient across the three models. The cyan arrows at the bottom of each subpanel indicate the model that received the highest number of cyan stars.

