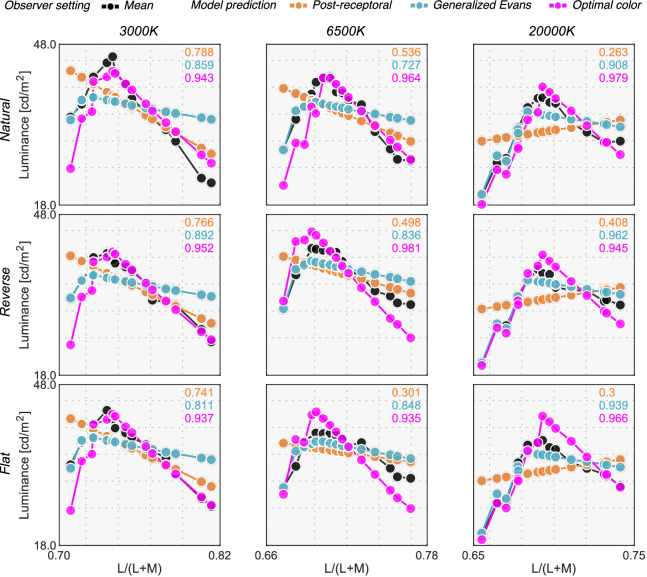
Figure A3.
Predictions from the post-receptoral model, the generalized Evans's model, and the optimal color model in Experiment 2. Each model prediction was scaled to give the minimum root mean square error between model prediction and mean observer setting. The correlation coefficients between model prediction and mean observer setting are shown at the right top corner in each panel. For the optimal color model, we used an estimated illuminant whose peak matched that of the observer settings (see Results section in Experiment 2 in the main text for more details).

