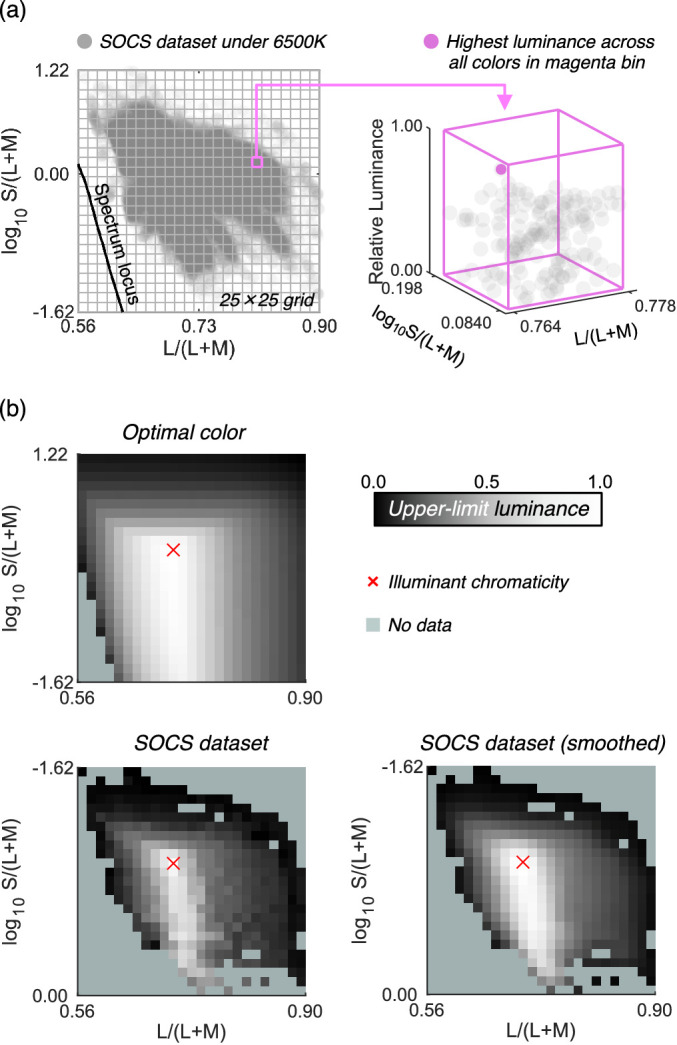
Figure 2.

How to estimate the upper-limit luminance for real objects using the SOCS spectral reflectance dataset. A 25 × 25 grid was first drawn on the MacLeod-Boynton chromaticity diagram. For each grid bin, we searched for the surface that has the highest luminance as shown in the right part of panel (a), which was defined as the upper-limit luminance for that chromaticity bin. Panel (b) shows the locus of upper-limit luminance for optimal color, real objects (raw), and real objects (smoothed) under 6500 K illuminant. The lightness indicates the upper-limit luminance value for the chromaticity bins. The pale green color indicates that there is no data in that bin.
