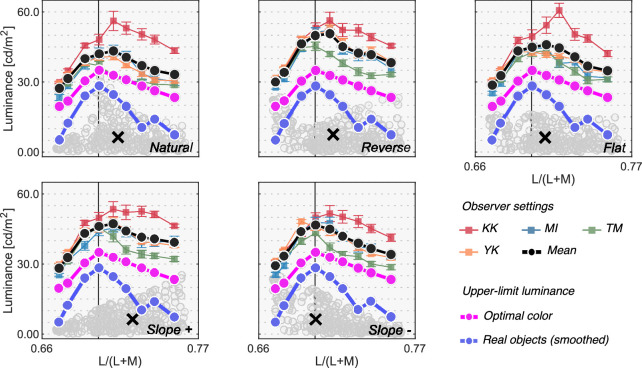
Figure 5.
Colored square symbols indicate averaged settings across 20 repetitions for each observer. The error bars represent ±1 SE across 20 repetitions. The black circles represent settings averaged across observers (n = 4). The magenta circles denote the luminance of the optimal color at the test chromaticities and thus indicate the physical upper-limit luminance. The blue line shows the upper-limit luminance of real objects estimated from the SOCS reflectance dataset. The vertical solid line shows the chromaticity of the test illuminant (6500 K). The black cross symbol indicates the mean LMS value across surrounding stimuli.

