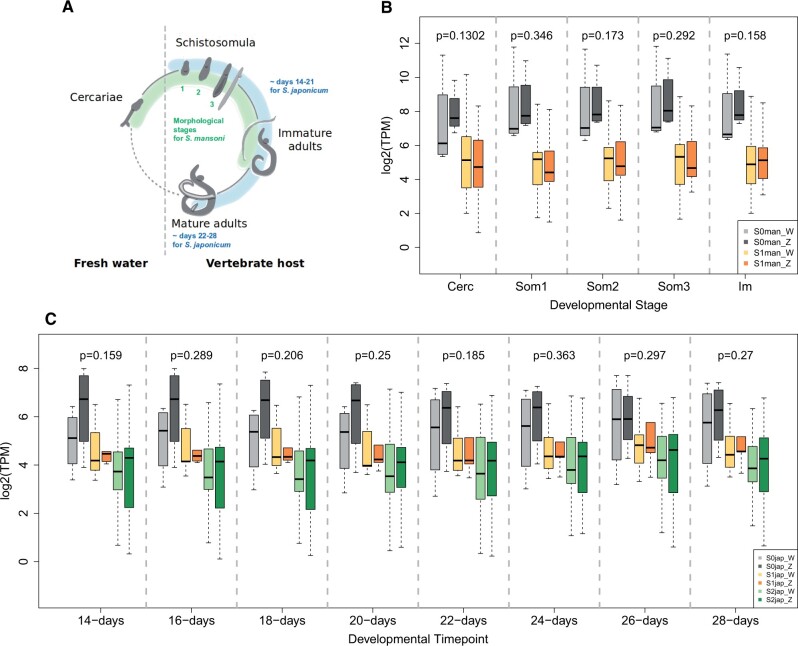
Fig. 3.
Distribution of S0, S1, and S2 W- and Z-gene expression throughout female development. Panel (A) shows a simplified schematic of the life cycle of schistosomes, depicting the larval stage in fresh water and the process of sexual maturation in the vertebrate host. The part of development represented in the expression data sets is shown in green for Schistosoma mansoni, and blue for S. japonicum. An additional data set with S. mansoni mature adults is plotted in supplementary figure 8, Supplementary Material online. Panel (B) shows gene expression values (TPM) for the S. mansoni W-candidates and their Z-homologs according to their respective strata (S0 in gray, S1 in orange) across five developmental stages: cercariae “Cerc,” three subsequent schistosomulum stages “Som1-3” and immature adult schistosomes “Im.” Panel (C) shows gene expression values (TPM) for the S. japonicum W-candidates and their Z-homologs according to their respective strata (S0 in gray, S1 in orange, S2 in green) across eight different developmental time points (in days postinfection). P values above each boxplot denote the significance of the difference in expression between W- and Z-derived transcripts, considering all strata together (Wilcoxon test).

