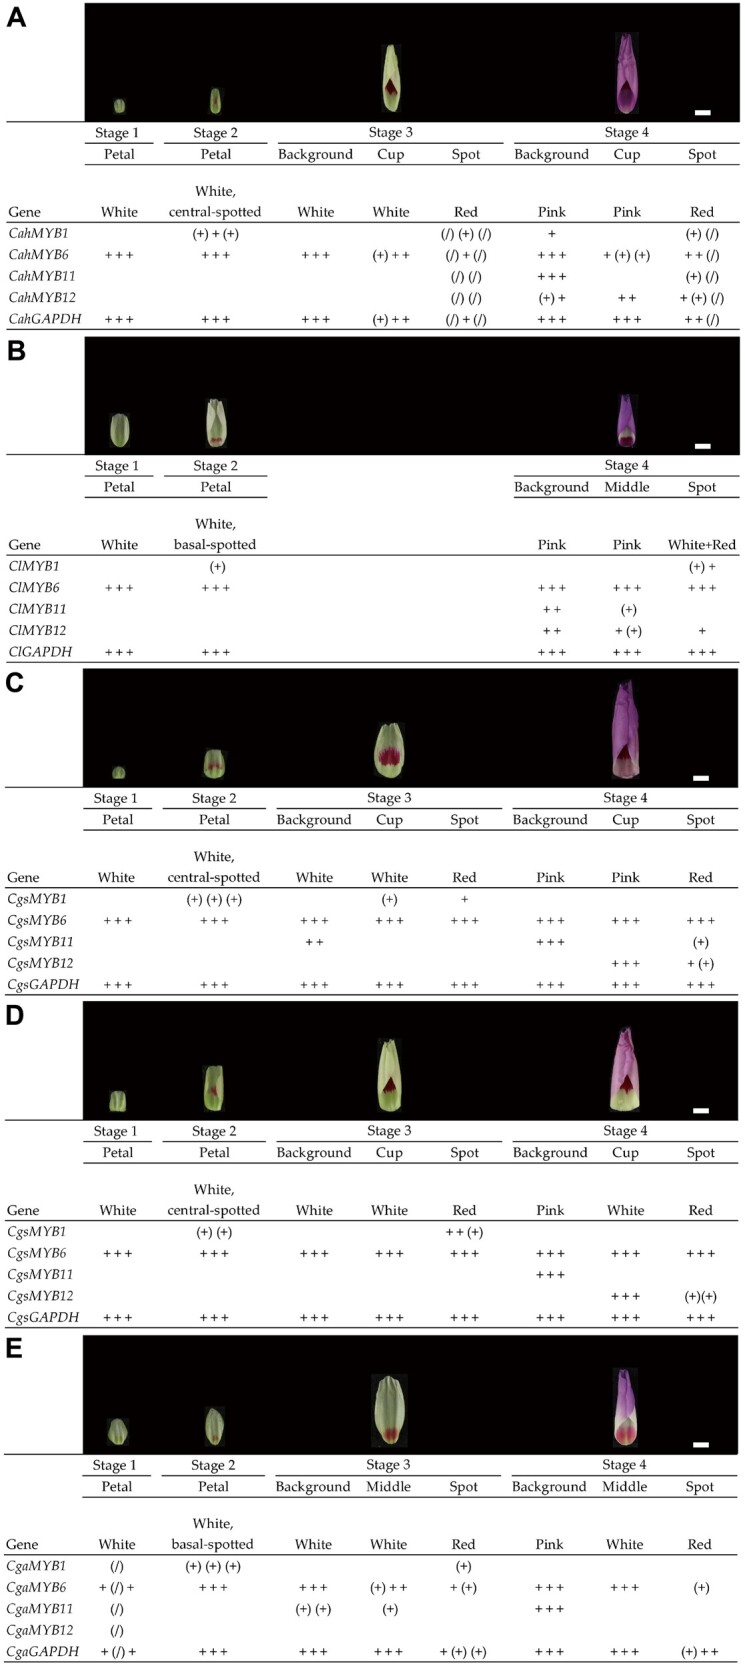
Fig. 4.

Expression patterns of MYB1, MYB6, MYB11, and MYB12 across the flower bud development in (A) Clarkia amoena huntiana, (B) C. lassenensis, (C) pink-cupped C. g. sonomensis, (D) white-cupped C. g. sonomensis, and (E) C. g. albicaulis. Based on the PCR-band brightness on the gels (see supplementary fig. S2, Supplementary Material online for gel photos), the expression levels were scored as “+,” “(+),” and blank, respectively, representing expressed, weakly expressed, and not expressed. A “+,” “(+),” or blank represents a single plant. A “(/)” indicates a missing data point. A constitutively expressed gene GAPDH was included for cDNA quality control. Pictures above the columns designate the bud phenotypes. The scale bar indicates 5 mm.
