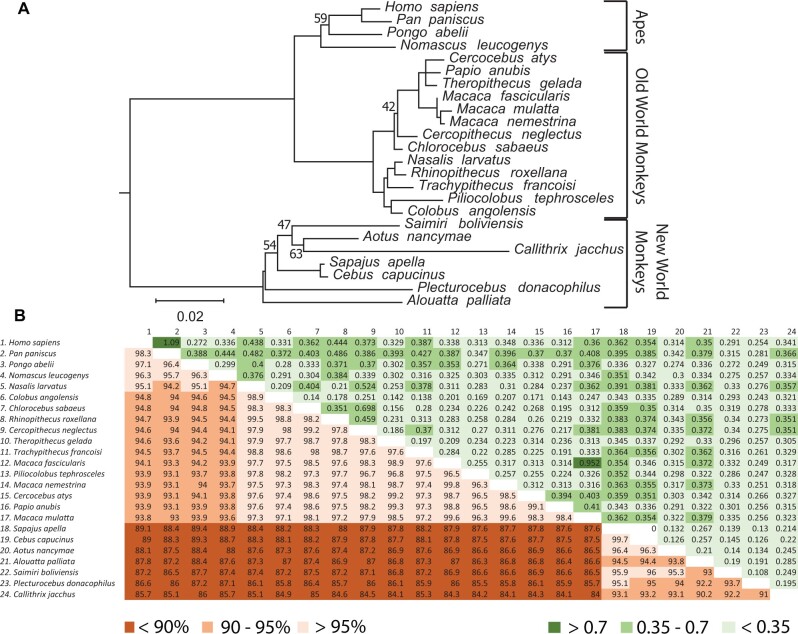
Fig. 6.
Evolution of pre-gagV1 in Simiiformes. (A) pre-gagV1 ORFs from the indicated primate species were aligned (supplementary data set 2, Supplementary Material online) and a maximum likelihood tree was generated using RaxML with 500 replicates. Bootstrap values that are below 70 are shown at the relevant nodes. The tree was midrooted. Phylogenetic classifications are shown on the right. Scale bar represents 0.02 nucleotide substitutions per site. (B) Pairwise percentage nucleotide identity (lower triangle) and the pairwise dN/dS values (upper triangle) of pre-gagV1 of the indicated simian primate species are shown. Color coding for each series is shown below the figure.

