Fig. 9.
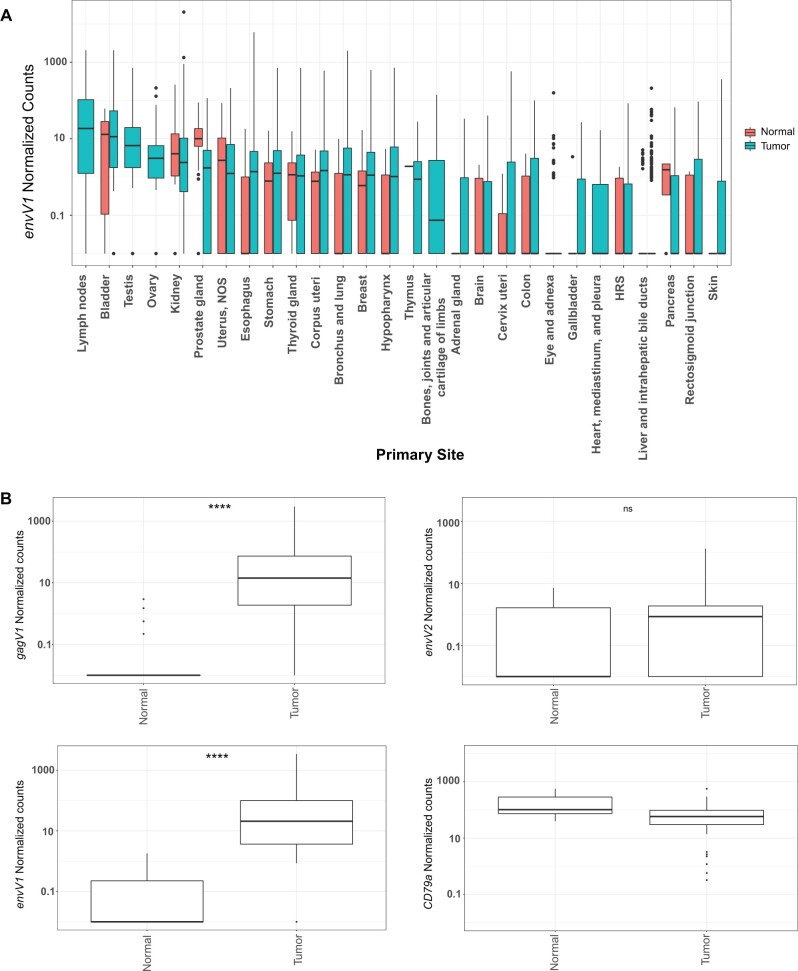
Expression of gagV1 and envV1 is upregulated in DLBCL samples. (A) Htseq count data from RNA sequencing samples were extracted from the NCI-GDC data portal and normalized using DEseq2. Box plot with the normalized count values for envV1 (log scale) in the y-axis and the primary isolation site of the normal or tumor samples in the x-axis is shown. (B) Raw RNA sequencing data extracted from six different SRA projects (see supplementary methods, Supplementary Material online, for project numbers) that represent 74 primary DLBCL tumor samples and 33 naïve and germinal B-cell samples were mapped to the human genome assembly and the counts that map to the coding region of each indicated gene were extracted via featurecounts and normalized using DEseq2. CD79a is a B-cell-specific marker and was used to confirm the accuracy of mapping and normalization (Mason et al. 1995). Box plots of normal and tumor samples (x-axis) with the normalized count values for the indicated genes (log scale) in the y-axis are shown. Samples with 0 count values were changed to 0.01 for visualization in the log scale. Statistical significance comparing tumor and normal counts for each indicated gene was estimated with the Welch two-sample t-test. ****P-value < 0.0001. ns, not significant. Box plots were generated using the ggplot2 R package.

