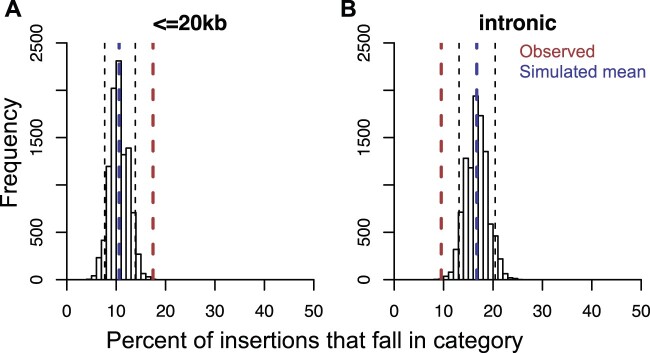
Fig. 4.
CrERV insertions are enriched within 20 kb of genes and depleted in introns. We determined the expected number of CrERV insertions near genes if integrations were random by simulation using the de novo assembled MT273 genome. The proportion of random insertions expected within 20 kb of a gene from the 10,000 replicates is shown in panel (A). The proportion of intronic insertions is in panel (B). The distribution of insertions within 20 kb of a gene or an intron from the simulation is shown as a histogram. Blue dashed lines indicate the mean of the simulated data. Red dashed lines indicate the observed data in MT273. Black dashed lines indicate the 5th and 95th percentile of the simulated data, which are used to call significant differences.

