Fig. 6.
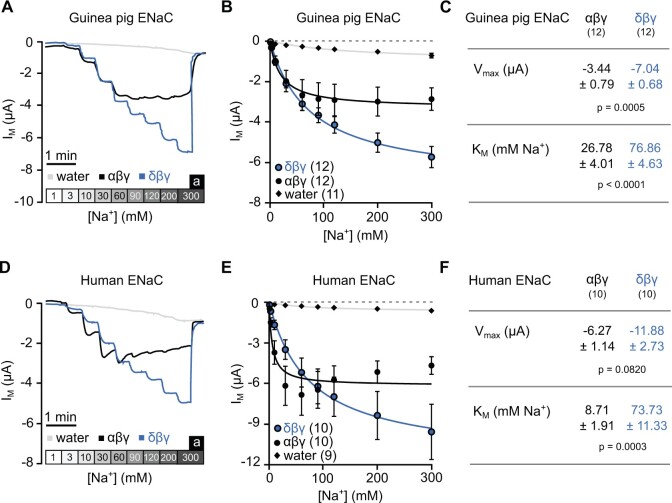
Both human and guinea pig δβγ-ENaC have increased activity compared with αβγ-ENaC at high extracellular Na+ concentrations. (A) Representative transmembrane current (IM) traces for guinea pig αβγ- and δβγ-ENaC expressing oocytes as well as water-injected control oocytes. Boxes shaded in gray represent the different extracellular [Na+] in mM. (B) The IM values of guinea pig ENaC expressing oocytes were plotted against the extracellular [Na+] and fitted to the Michaelis–Menten equation allowing the estimation of Vmax and the KM. (C) The Vmax values and KM values of guinea pig αβγ- and δβγ-ENaC expressing oocytes (Mann–Whitney U test). (D–F) Similar to A–C except for oocytes expressing human ENaC orthologs and separate water-injected control oocytes. Data shown in panel (F) were statistically analyzed with Student’s unpaired t-test with Welch’s correction. Numbers in parentheses indicate (n).

