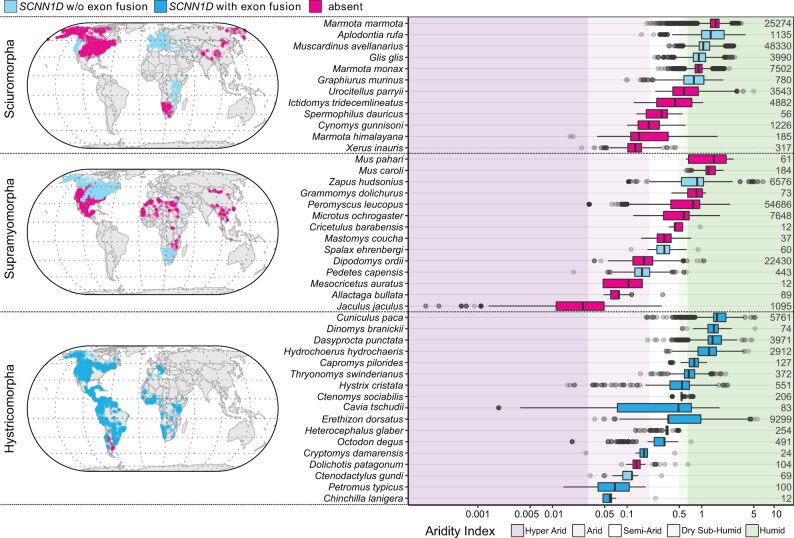
Fig. 9.
The loss of SCNN1D does not generally correlate with habitat aridity. Geolocation data of the rodent species listed in table 1 were extracted from the Global Biodiversity Information Facility (GBIF) and were used to plot the global distribution of noninvasive rodent species of the clades Sciuromorpha, Supramyomorpha, and Hystricomorpha. Global distribution of individual species is provided in supplementary figures 2–5, Supplementary Material online. Observations for the indicated species were also plotted with corresponding habitat aridity. Mixed effects models suggest that the absence or presence of functional SCNN1D in the investigated species does not explain any significant proportion variation in habitat aridity. The colors indicate absence or presence of functional SCNN1D: Light blue=SCNN1D without exon fusion; Dark blue=SCNN1D with exon fusion; Magenta=species without functional SCNN1D (pseudogene and complete gene loss). Background colors differentiate habitats following the generalized climate classification scheme for aridity index values (Middleton and Thomas 1997). Species are ordered based on ascending median aridity within each clade. The numbers to the right of the plots indicate the number of GBIF observations that were extracted for each species.

