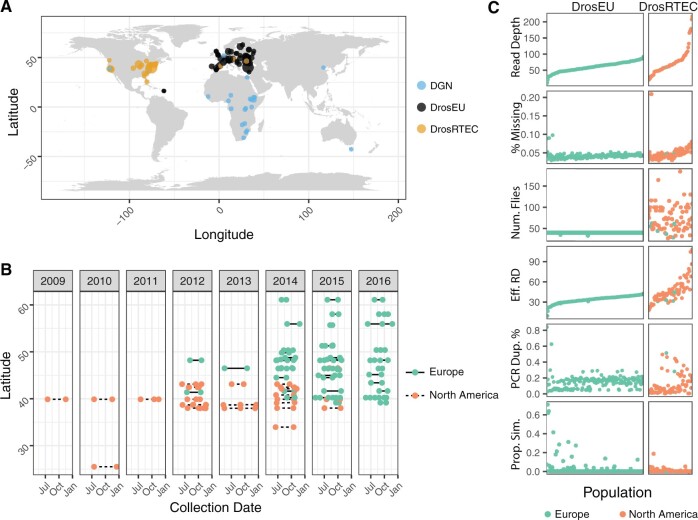
Fig. 1.
Sampling location, dates, and quality metrics. (A) Map showing the 271 sampling localities forming the DEST data set. Colors denote the data sets of origin (DGN, DrosEU, or DrosRTEC). (B) Collection dates for localities sampled more than once. (C) General sample features of the DEST data set. The x-axis represents the population sample, ordered by the average read depth.

