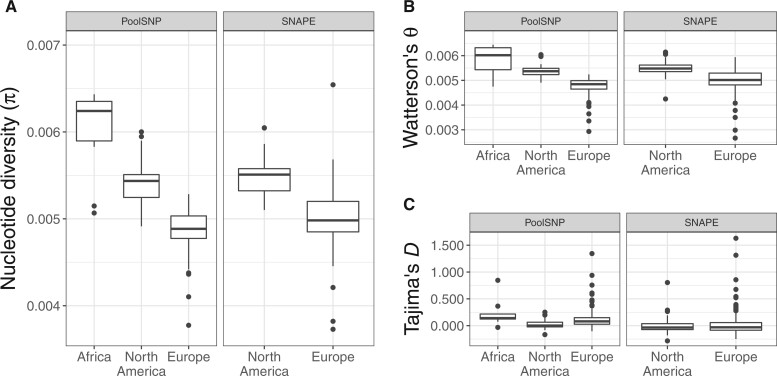
Fig. 6.
Population genetic estimates for African, European, and North American populations. Shown are genome-wide estimates of (A) nucleotide diversity (π), (B) Watterson’s θ and (C) Tajima’s D for African populations using the PoolSNP data set, and for European and North American populations using both the PoolSNP and SNAPE-pooled (SNAPE) data sets. As can be seen from the figure, estimates based on PoolSNP versus SNAPE-pooled (SNAPE) are highly correlated (see main text). Genetic variability is seen to be highest for African populations, followed by North American and then European populations, as previously observed (e.g., see Lack et al. [2016] and Kapun et al. [2020]).

