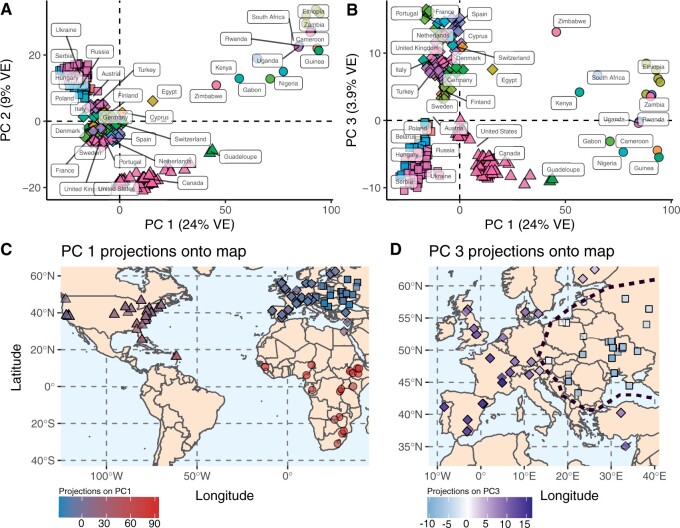
Fig. 7.
Demographic signatures of the DrosEU, DrosRTEC, and DGN data (using the PoolSNP pipeline). (A) PCA dimensions 1 and 2. The mean centroid of a country’s assignment is labeled. (B) PCA dimensions 1 and 3. (C) Projections of PC1 onto a World map. PC1 projections define the existence of continental level clusters of population structure (indicated by the shapes circles: Africa; triangles: North America; diamonds and squares: Europe). (D) Projections of PC3 onto Europe. These projections show the existence of a demographic divide within Europe: the diamond shapes indicate a western cluster, whereas the squares represent an eastern cluster. For panels (C) and (D), the intensity of the color is proportional to the PC projection. The black dashed line shows the two-cluster divide.

