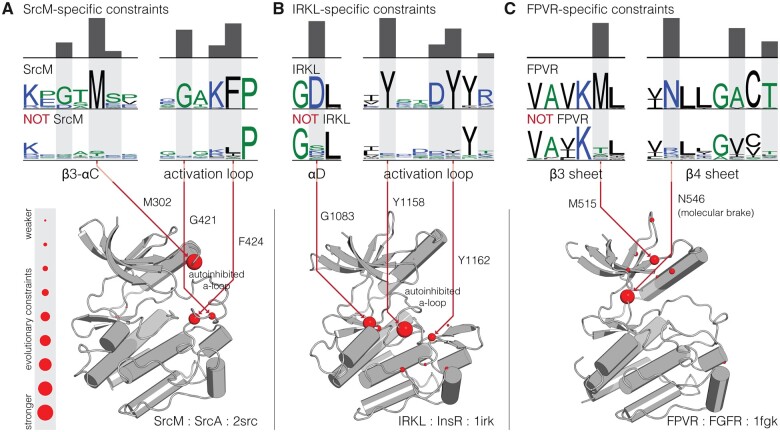
Fig. 3.
Structural locations of sequence motifs defining the SrcM, IRKL, and FPVR subgroups. Comparative sequence logos and structural mappings of subgroup-specific motifs are shown for the (A) SrcM, (B) IRKL, and (C) FPVR subgroups of tyrosine kinases. Sequence logos for the strongest evolutionary constraints corresponding to each subgroup are shown on top, with comparative sequence logos for sequences outside each subgroup provided below. Evolutionary constraints are highlighted in gray, with the height of the histogram reflecting the degree of divergence at that position between the subgroup and sequences outside the subgroup. Evolutionary constraints are shown as red balls on representative inactive structures of SrcM (Src) (Xu et al. 1999), IRKL (IRK) (Hubbard et al. 1994), and FPVR (FGFR1) (Mohammadi et al. 1996). The size of the red balls represents the strength of the evolutionary constraint. The strongest constraints are labeled with residue numbers corresponding to the position in the representative structures.

