Figure 10.

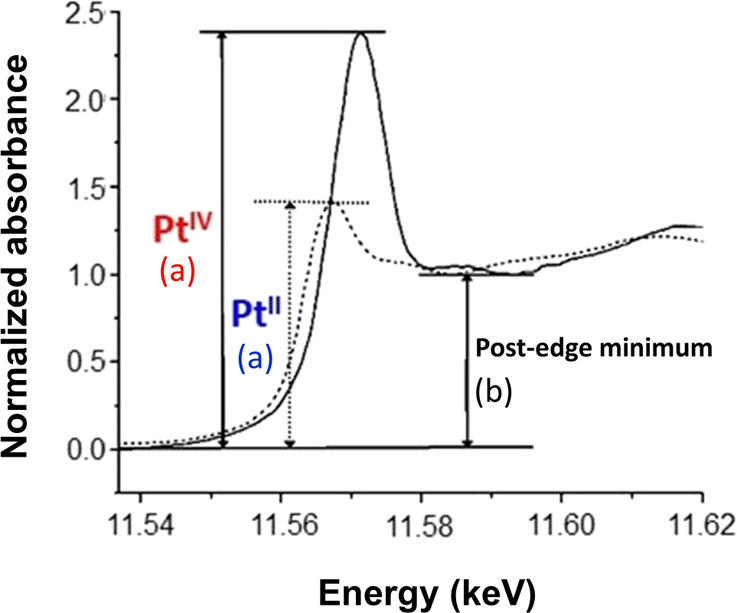
XANES spectra of PtIV and PtII compounds showing the maximum peak absorption (a) for each oxidation state and the post-edge minimum (b). Adapted from ref (73). Copyright 2003 American Chemical Society as modified from a literature figure.

XANES spectra of PtIV and PtII compounds showing the maximum peak absorption (a) for each oxidation state and the post-edge minimum (b). Adapted from ref (73). Copyright 2003 American Chemical Society as modified from a literature figure.