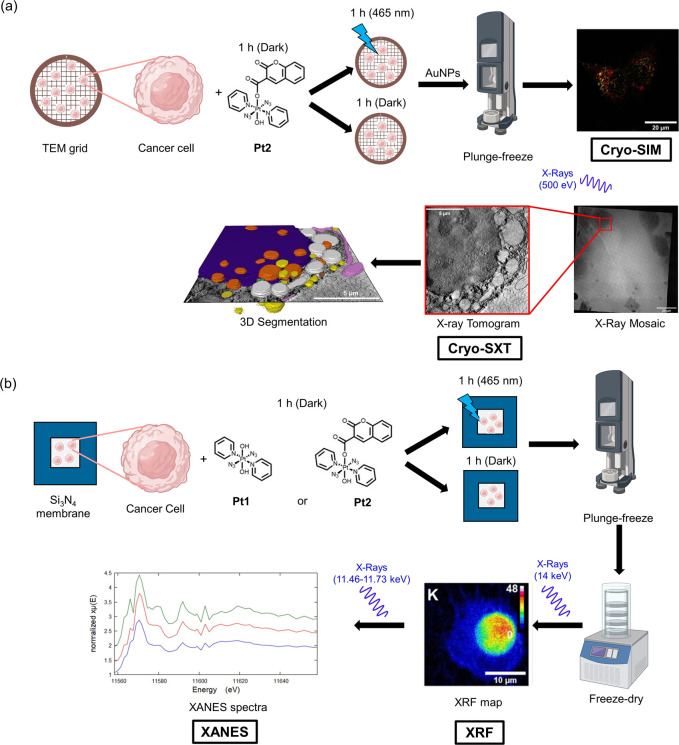
Figure 2.
Summary schematic for methods used in this work. (a) cryo-structured illumination microscopy (SIM) and cryo-soft X-ray tomography (cryo-SXT). Cancer cells were grown on TEM carbon–gold grids before exposure to Pt2 under dark and irradiated conditions then washed with buffer, incubated with fluorophores (MitoTracker and LysoTracker), blotted with gold nanoparticle (AuNP) fiducials (d = 250 nm), and plunge-frozen in liquid ethane. These cryopreserved cells were then analyzed by super-resolution fluorescence microscopy (cryo-SIM) down to 200 nm resolution. The same cryopreserved cells were imaged using cryo-SXT using X-rays in the water window (500 eV) to obtain 3D information down to 40 nm resolution. (b) X-ray fluorescence (XRF) and X-ray absorption near edge structure (XANES) spectroscopy. Cancer cells were grown on silicon nitride (Si3N4) membranes before exposure to Pt1 or Pt2 under dark and irradiated conditions then washed with buffer followed by sterile water, blotted, and plunge-frozen in liquid propane–ethane mixture. These cryopreserved samples were then freeze-dried for XRF and XANES analysis at ambient temperature. XRF elemental maps of cells were acquired using hard X-rays (14 keV) above the L3M5 absorption edge of Pt by raster scanning the nanobeam across the cell in 2D, achieving 100 nm resolution. XANES spectra of Pt in cellular regions were collected by scanning the energy around the Pt L3-edge (11.46–11.73 keV) and either averaging the XRF maps at each energy or taking a reduced number of selected energies from which an approximation of the XANES could be extracted. This image was created using biorender.com.

