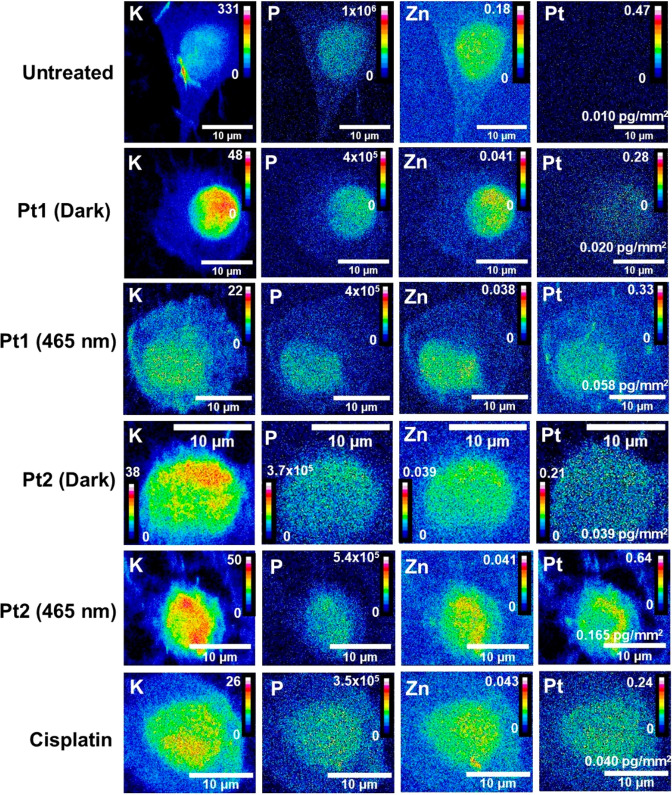
Figure 6.
Comparison of the distribution of K, P, Zn, and Pt in whole PC3 human prostate cancer cells before and after treatment with dihydroxido complex Pt1 or coumarin derivative Pt2 in the dark and after irradiation with blue light, and cisplatin after irradiation. Synchrotron–XRF elemental maps were analyzed for cryo-fixed and dehydrated PC3 cells before and after treatment with Pt1 (see also Figures S31–S33) or Pt2 (Figures S37–39) in the dark and Pt1 (Figures S34–S36), Pt2 (Figures S40–S42), and cisplatin after irradiation with blue light (Figures S28–S30), in addition to untreated controls (Figures S25–S27). Conditions: with equipotent (5× photoIC50) Pt1 (275 μM) and Pt2 (32.5 μM), in the dark (2 h protected from light), or exposed to Pt1, Pt2, or cisplatin for 1 h, followed by 1 h irradiation with 465 nm light (17 J/cm2). Element levels are represented using 16 colors in units of pg/mm2 in ImageJ (red = high and blue = low elemental quantities).69 Data were acquired using an energy of 14 keV, 0.1 s dwell time, and 100 × 100 nm2 step size. Intracellular quantities of Pt in cells treated with Pt1 or Pt2 under dark conditions were significantly elevated upon blue light exposure. Intracellular levels of Pt in cells treated with 5× photoIC50 of Pt1 (275 μM) or Pt2 (32.5 μM) upon irradiation were significantly greater than for cells treated with 5× photoIC50 of cisplatin (500 μM) under the same photoconditions.

