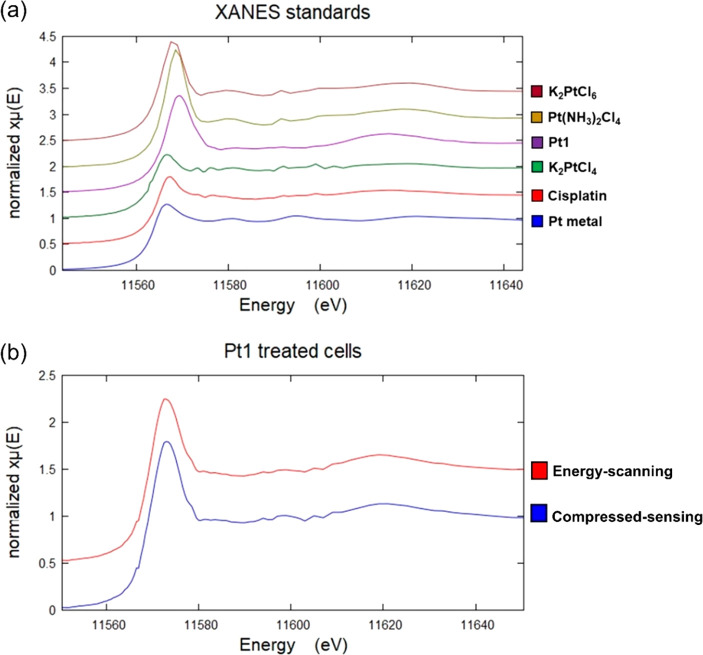
Figure 8.
(a) Stacked plot of normalized XANES spectra of solid pellets of K2PtCl6 (burgundy), Pt(NH3)2Cl4 (yellow), Pt1 (purple), K2PtCl4 (green), cisplatin (red), and Pt metal (blue). The spectra were analyzed using Athena XAS Data Analysis Software.71 Pre-edge normalization was performed in the energy range 11.47–11.54 keV, and the post-edge normalization was performed in the range 11.59–11.75 keV with a normalization order = 2. (b) Stacked plot of normalized XANES spectra of intracellular Pt in two independent 5 × 5 μm2 regions of cryo-fixed and dried PC3 cells treated with 5× photoIC50 (275 μM) of Pt1 (1 h exposure +1 h 465 nm): energy-scanning (red) and compressed-sensing (blue). The spectra were analyzed in Athena XAS Data Analysis Software.71 Pre-edge normalization was performed in the energy range 11.47–11.54 keV, and the post-edge normalization was performed in the range 11.59–11.75 keV with a normalization order = 2.

