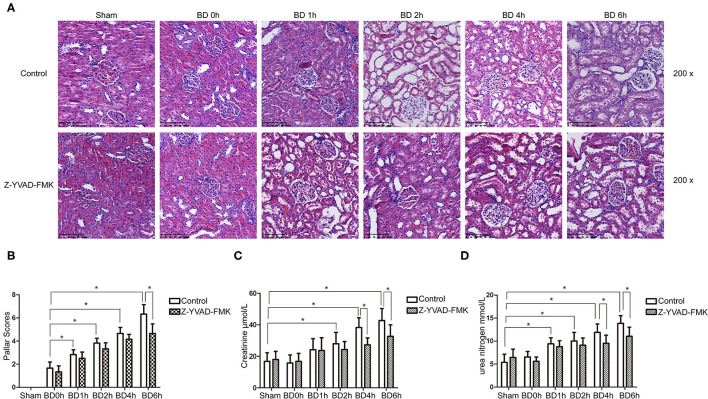
Figure 1.
HE staining, Paller scores and renal function results in control cohort and Z-YVAD-FMK-treated cohort. There were sham, 0, 1, 2, 4, and 6 h group (n = 6 in each group) in each cohort. HE appearance after (A). Paller score (B). Serum creatinine levels (C). Urea levels (D). *p < 0.05. BD = brain-death; Sham = without brain death; HE = Hematoxylin and eosin.

