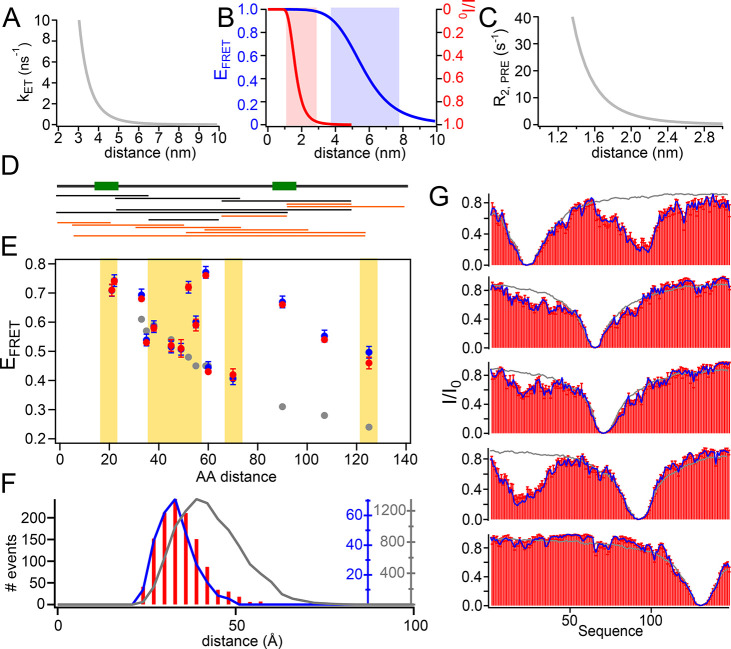
Figure 3.
ASTEROIDS selection based on PREs and FRET efficiencies. (A) Dependence of the FRET rate (kET) on distance with a Förster radius of 56 Å and a fluorescence lifetime of the donor (τD) of 4 ns. (B) Dependence of the FRET efficiency (EFRET) on distance for a kET as displayed in A (blue curve, blue y axis). The red curve with the red y axis shows the dependence of peak intensity ratios (I/I0) for a paramagnetic as compared to a diamagnetic sample at a PRE rate described in C. Red and blue shading illustrate the distance ranges to which FRET and PREs are sensitive. (C) PRE rate (R2,PRE) dependence on the distance between the proton and electron spins for τc = 5 ns, with τc = τrτs/(τr + τs), τr being the rotational correlation time of the protein and τs the effective electron relaxation time (see ref (38)). Note that reorientation dynamics of the spin label was not taken into account for this illustration, but was considered in the ensemble calculations. (D) Schematic of a 155 residue long IDP comprising a long-range interaction between regions indicated by green boxes. Below: Distances for which EFRET has been calculated after in silico addition of the fluorescent dyes. Black protein constructs have been used in the ASTEROIDS selection; orange protein constructs have been used for cross validation (corresponding EFRET above yellow background in E). See also SI Figure 2 for a more detailed scheme. (E) FRET efficiencies plotted against the amino acid distance between the labels of a flexible-meccano ensemble (gray), the simulated ensemble with a long-range contact (blue), and an ensemble selected based on six FRET efficiencies and five PRE labeling positions (red). Only EFRET on a white background have been used in the selection. Cross-validated distances are on a yellow background. Error bars on the blue points indicate the error in FRET efficiency that was allowed in the selection (0.02). Error bars on the red points refer to the standard deviation of EFRET calculated from six independent selections. (F) Histogram of average pairwise Cα–Cα distances of the flexible-meccano ensemble (gray), the simulated ensemble (blue), and the ensemble selected based on PREs and six different FRET distances (red bars). (G) PREs of a flexible-meccano ensemble (gray lines), of the simulated ensemble with a long-range contact (blue lines), and of the selected ensemble (red bars). All simulated PREs (in blue) were used in the selection. Red error bars are standard deviations over six independent selections.

