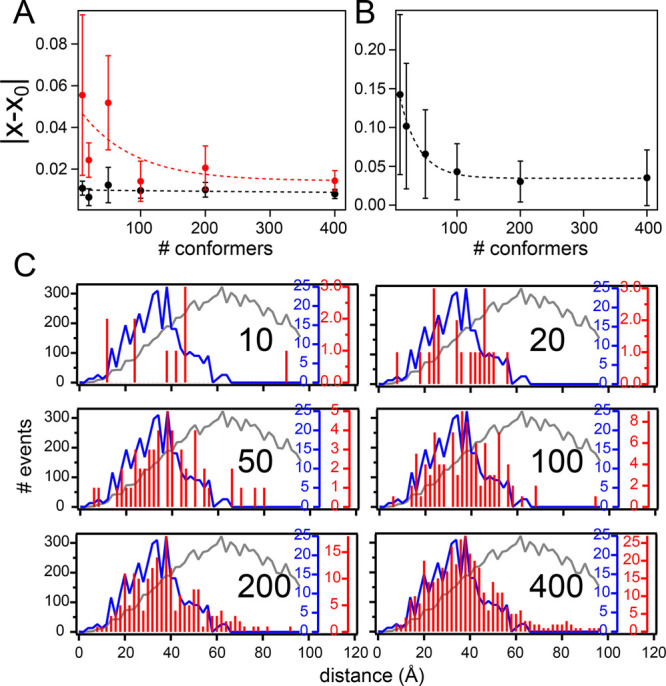
Figure 4.

Varying the size of the selected ensemble. (A and B) Averaged absolute deviations of the FRET efficiency (A) or PRE (B) as calculated from the selected ensemble (x) from the respective values of the target in silico ensemble (x0). Error bars show the corresponding standard deviations. Red points illustrate data not used in the selection. Ensemble sizes were 10, 20, 50, 100, 200, or 400 conformers. Dashed lines represent exponential fits representing the trend of the data. (C) Cα–Cα distances between the in silico labeling sites 2 and 92 for different ensemble sizes. In red are the distances calculated from one selection based on six FRET efficiencies and using five PRE labeling sites. The expected Cα–Cα distances are shown in blue; the distances obtained from a flexible-meccano statistical coil ensemble in gray. Black numbers inside the graphs indicate the numbers of conformers used in the selected ensembles.
