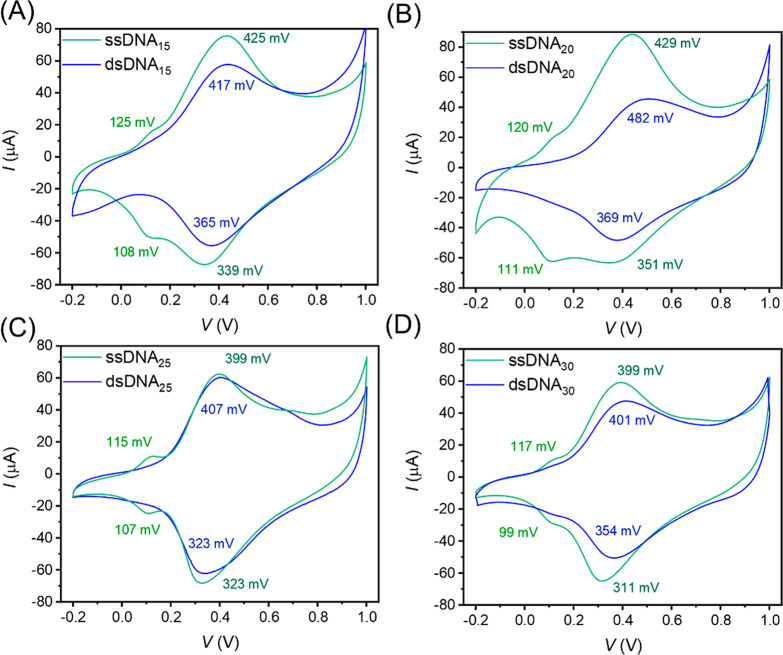
Figure 2.
Representative cyclic voltammograms for SAMs of Fc terminated ssDNAn (green) and dsDNAn (blue) (n = (A) 15, (B) 20, (C) 25, and (D) 30) on Au, recorded against a Ag/AgCl reference electrode with aqueous 1.0 M NaClO4 and 10 mM NaH2PO4 at pH 8.0 as the electrolyte at a scan rate of 1.0 V/s. The peak oxidation and reduction potentials are denoted in the respective colors.

