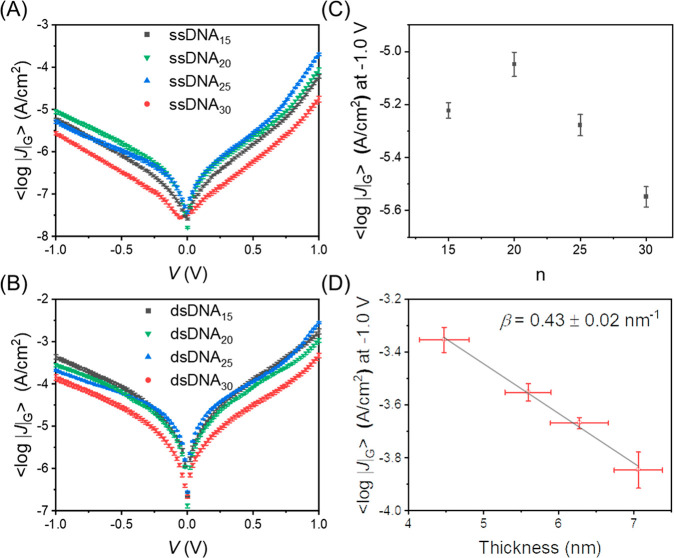
Figure 4.
Plots of ⟨log|J|⟩G vs V for (A) Au-linker-ssDNA-Fc//GaOx/EGaIn and (B) Au-linker-dsDNA-Fc//GaOx/EGaIn. Error bars represent 95% confidence bands. (C) Plot of ⟨log|J|⟩G at −1.0 V vs the number of ssDNA base pairs and (D) plot of ⟨log|J|⟩G at −1.0 V vs ellipsometry thickness of Au-linker-dsDNA-Fc SAM. The solid line represents a fit to eq 1, y-axis error bars represent the 95% confidence intervals. x-Axis error bars represent the standard deviation for 3–5 independent measurements. All measurements are recorded at ambient temperature (T = 298 K).

