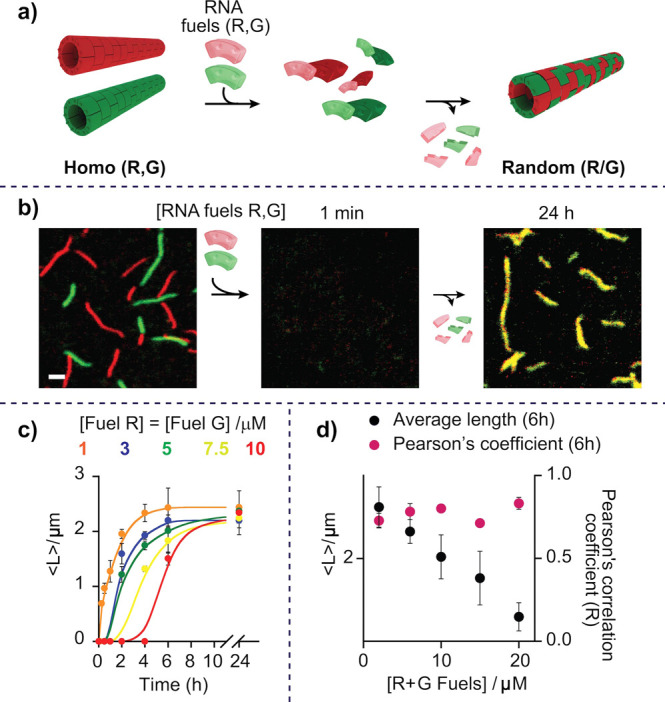
Figure 2.

(a) Reorganization from red and green homopolymers to a random (R/G) copolymer driven by RNA fuels. (b) Fluorescence confocal images showing the disassembly of the red (R) and green (G) homopolymers upon the addition of both RNA fuels (R, G) and the autonomous reassembly into R/G random copolymers in the presence of RNase H. Confocal images scale bar, 2.5 μm. (c) Kinetic traces showing autonomous reassembly of R/G random copolymers (average length, ⟨L⟩) upon the addition of different concentrations of (R, G) RNA fuels. (d) Average length and Pearson’s coefficient values of reassembled R/G random copolymers after 6 h from fuels addition. Statistical analysis of length distribution is also shown in Figure S5. [tile R] = [tile G] = 0.15 μM, [RNase H] = 30 U/mL, 1 × TAE buffer + 12.5 mM MgCl2 + 10 mM DTT, pH 8.0, 25 °C. Error bars represent standard deviation based on triplicate measurements.
