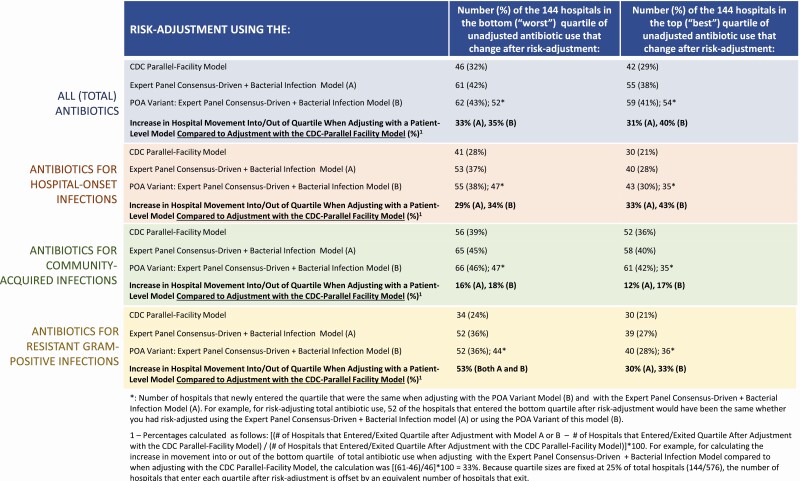
Figure 2.
Changes in number of hospitals ranked in the top or bottom quartiles of use, compared to rankings by unadjusted usage rates (DOTs/1000 patient-days), after risk-adjustment with: the CDC Parallel-Facility model, the Expert Panel Consensus-Driven + Bacterial Infection model, and the POA) variant of the Expert Panel Consensus-Driven + Bacterial Infection model. Abbreviations: CDC, Centers for Disease Control and Prevention; DOT, day of therapy; POA, present on admission.

