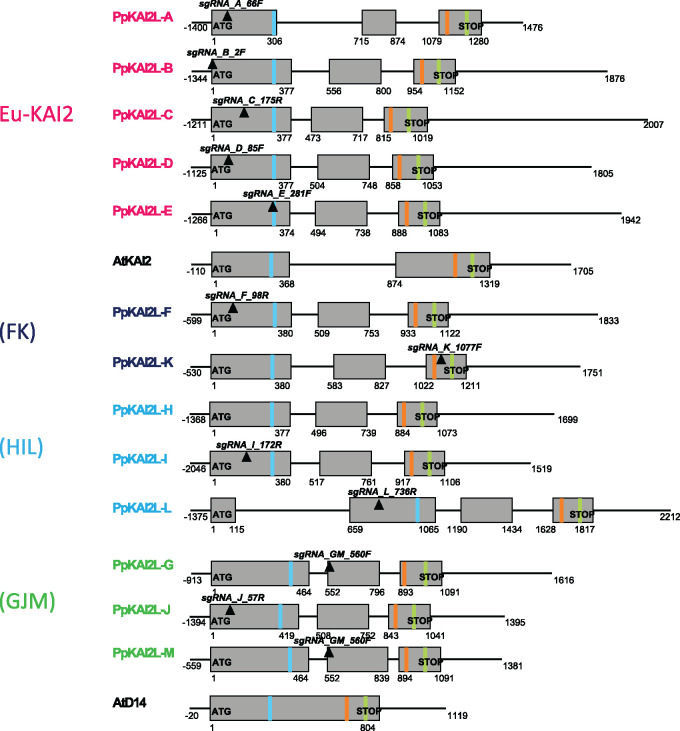
Figure 3.
Gene models of the PpKAI2L gene family showing the catalytic triad and position of crRNAs. Genes are presented as organized in subclades. Exons are displayed as grey boxes, introns and UTRs are depicted as thin black lines. Start and stop codons are written in bold, while plain text indicates the start/end position for each feature relative to the start codon. Only 5′-UTRs are not represented true to scale. Transcript versions that were used are V3.1 (downloaded from the Phytozome website in September 2019) for all PpKAI2L genes except for PpKAI2L-B, PpKAI2L-H, and PpKAI2L-M (V3.2). Regions targeted by crRNAs are indicated as black inverted triangles, with their names written in bold italics. Light blue, orange, and light green bands represent the codons for the S, D, and H residues of the catalytic triad, respectively (see Supplemental Table S3 for reference sequences).

