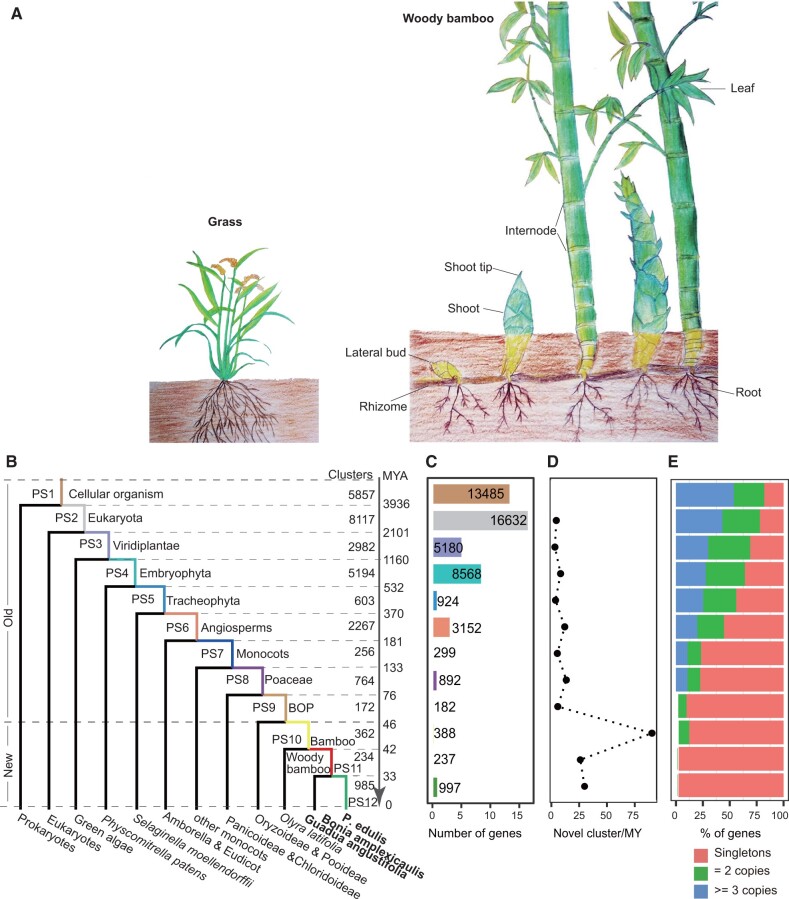
Fig. 1.
Morphological character and phylostratigraphic age of Phyllostachys edulis. (A) Comparison of the growth pattern of grass and woody bamboo. (B) Phylostratigraphic ages distribution of P. edulis. Numbers denote the number of nonredundant gene clusters per phylostratum (PS1−PS12). The tree stratifies species by major evolutionary innovations, from the emergence of simple unicellular organisms up to P. edulis. The dating of phylogenetic tree is from TimeTree (Kumar et al. 2017). (C) Number of genes per phylostratum. (D) Gene fixation rate per PS. (E) Gene copies distribution of each cluster.

