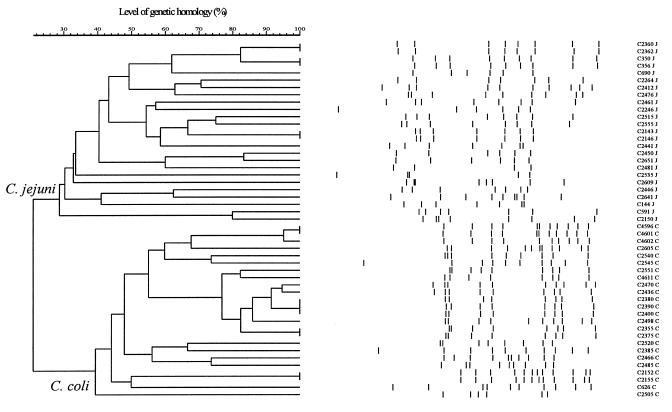
FIG. 2.
Dendrogram of the PFGE patterns with designated bands. Cluster analysis was performed as described for Fig. 1. The clusters representing C. jejuni and C. coli are indicated, and the species are indicated behind the strain number, with J indicating C. jejuni and C indicating C. coli. Isolate C2345, which was untypeable, is not shown.

