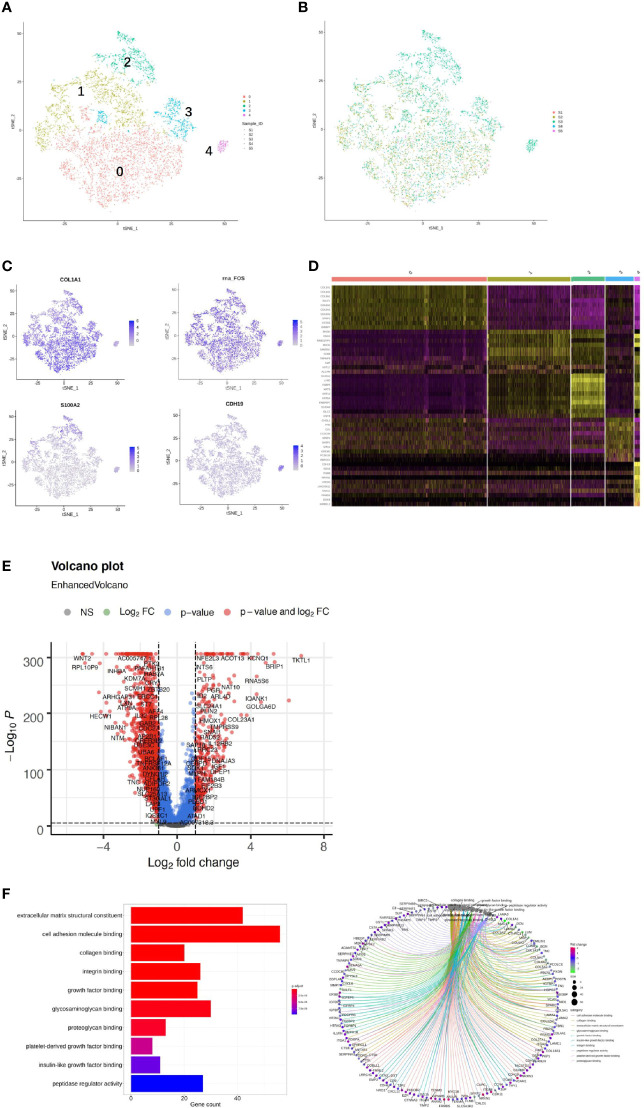
Figure 4.
Single-cell RNA sequencing (scRNA) profiles of fibroblast cell lineages. Reclustering of 8,329 fibroblast cells color-coded by (A) clusters and (B) sample origin (right). (C) t-Distributed stochastic neighbor embedding (t-SNE) plot color-coded for marker gene expression (gray to white to blue) for COLIAI, FOS, S100A2, and CDH19. (D) Heatmap shows differentially expressed marker genes (rows) in five clusters. Yellow and dark purple: high and low expression, respectively. (E) Volcano plot shows differentially expressed marker genes between cervicitis and cervical cancer samples. (F) Differences in pathway activities of cells between cluster 1 (C1), C2, C3, and C4.

