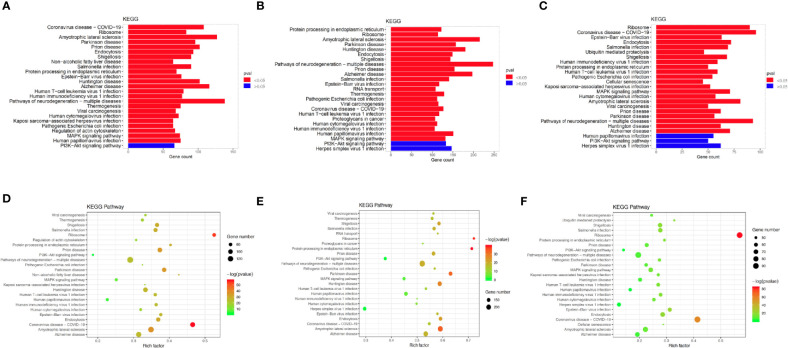
Figure 8.
Differences in pathway activities scored using Kyoto Encyclopedia of Genes and Genomes (KEGG) database between chemoresistant and chemosensitive samples. Top 25 differentially expressed genes (DEGs) enriched KEGG functional annotation on (A) epithelial, (B) T, and (C) B cells. The x-axis indicates the number of genes annotated to pathway and proportion of all DGEs, and the y-axis shows KEGG metabolic pathway. Red bar (p < 0.05). Scatter plot of the top 25 DEGs enriched in the KEGG pathway on (D) epithelial, (E) T, and (F) B cells. Each circle indicates a KEGG pathway. Ordinate is log10 (Q value), color-coded from green to orange to red. Circle sizes indicate enrichment level of DEGs in pathway. Q value: p-value after multiple hypothesis tests.

