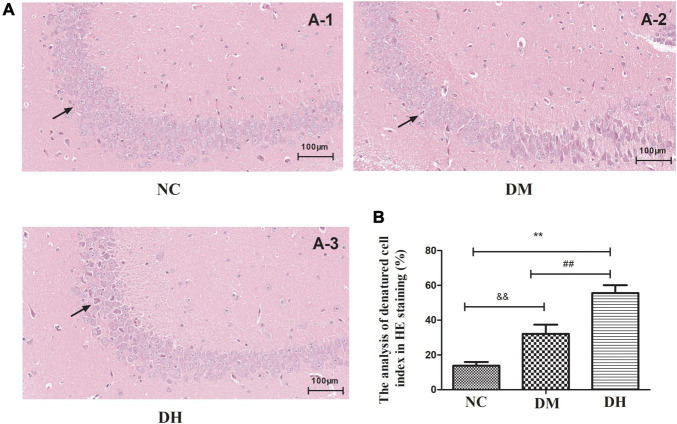
FIGURE 3.
Severe hypoglycemia under diabetic conditions causes histological changes in the hippocampal region. The black arrowheads indicate layers of pyramidal cells. (A-1): NC; (A-2): DM; (A-3): DH. Scale bar = 100 μm (HE staining). N = 3 per group. Data are the means ± SEM. **P < 0.01 NC vs. DH, &&P < 0.01 NC vs. DM, ##P < 0.01 DM vs.DH.

