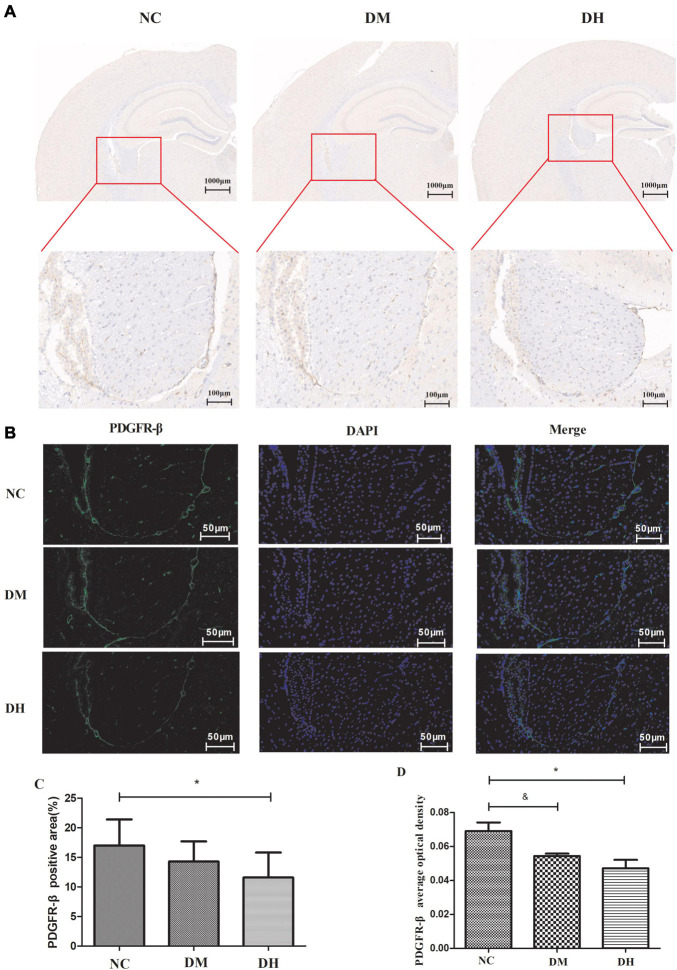
FIGURE 4.
Effect of severe hypoglycemia on PDGFR-β expression in diabetic mouse hippocampus. (A) Representative images of immunohistochemical photographs of PDGFR-β in the brain. (B) Quantitation of PDGFR-β accumulation. (C) PDGFR-β positive expression is observed as green fluorescence; DAPI-stained nuclei are blue under UV excitation. (D) Comparison of quantitative analysis of mean optical density in the mice with positive PDGFR-β expression in brain capillary mid-peripheral cells in the hippocampus. Scale bar = 50 μm. N = 3 per group. Data are the means ± SEM. &P < 0.05 NC vs. DM, *P < 0.05 NC vs. DH.

