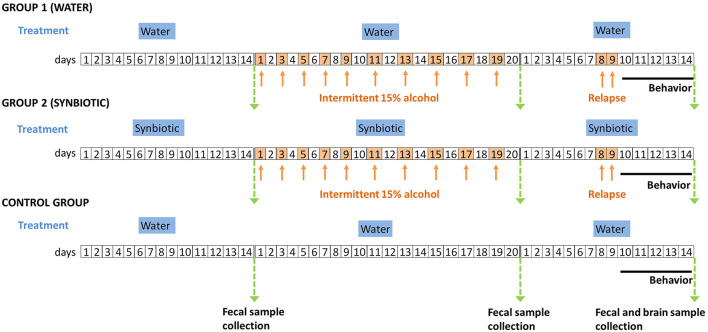
Figure 1.
Schematic diagram of the experimental procedures followed in the study. Group 1 (males and females) were treated with water and Group 2 (males and females) were treated with synbiotic during the entire procedure. The control group was treated with water and never received alcohol, and was included in the post-relapse behavioral analyses. The timeline of the experiments (days) is shown in squares. White squares represent days where mice drank water plus the corresponding treatment (in blue titles), and orange squares (and arrows) represent the days where mice drank alcohol (15% ethanol solution in water) plus the corresponding treatment. Green arrows represent the days of sample collection. The solid black line indicates the days of post-relapse behavioral testing.

