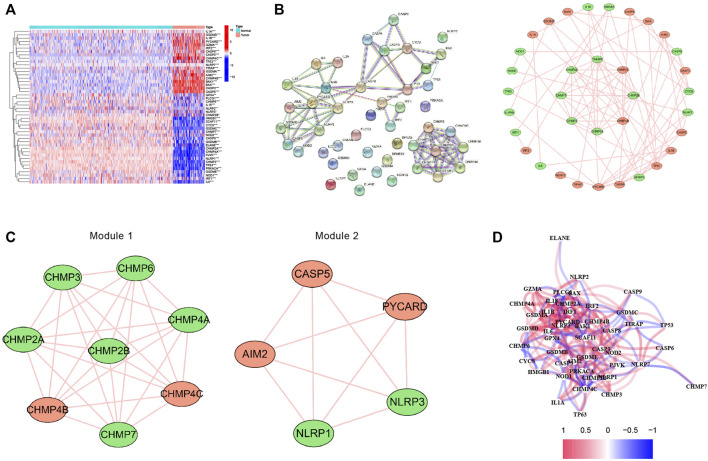
FIGURE 2.
Expression and interconnectedness of the pyroptosis-related genes in osteosarcoma. (A) The heatmap showed the differential expressed PRGs between human osteosarcoma samples and normal muscle tissues (red: high expression level, blue: low expression level). (B) PPI network of differentially expressed PRGs (The red nodes indicate upregulated PRGs and the green nodes indicate downregulated PRGs) (C) Critical modules from the PPI network. (D) The correlation network of the differential expressed PRGs (red lines indicate positive correlation and blue lines indicate negative correlation). PRGs, pyroptosis-related genes.

