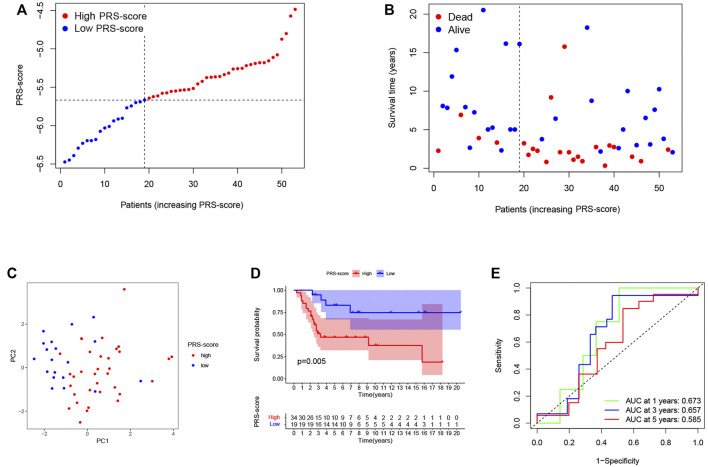
FIGURE 5.
Validation of the prognostic signature in the GEO cohort. (A) The PRS-score distribution of the patients with osteosarcoma in the GEO cohort. (B) The survival status and survival time distribution of the patients with osteosarcoma in the GEO cohort. (C) PCA plot based on the PRS-scores in the GEO cohort. (D) Kaplan–Meier curves of the high and low PRS-score subgroups in the GEO cohort. (E) Time-dependent ROC curve for predicting 1-, 3-, and 5-year overall survival in the GEO cohort.

